Cardiac Output Simulation for Specific Makes of Monitors
Cardiac output simulation for specific makes of monitor
By Dennis McMahon, Dennis McMahon Consulting
 Theory
The measurement of the volume of blood pumped by the heart is a valuable diagnostic tool in the management of patients undergoing major cardiovascular surgery and for critically ill patients elsewhere in the medical center. Cardiac output (CO) is an indicator of the efficiency of the heart and the status of the entire vascular system. Although methods for determining continuous CO are available, the thermodilution technique is widely used in the Operating Room, the Intensive Care Unit, and the Cardiac Catheterization Lab since it was introduced in the 1970’s.
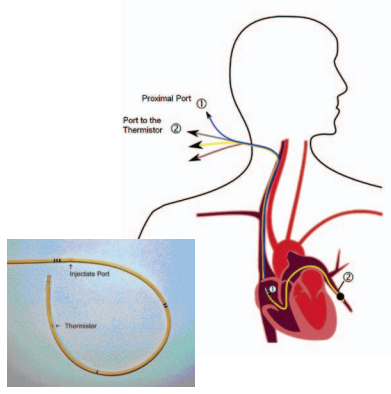
This method requires the placement of a SwanGanz catheter in the pulmonary artery. As the name implies, the technique involves briefly decreasing the temperature of the blood in the pulmonary artery by injecting a known quantity of saline into the bloodstream at the right atrium, then detecting the decrease in temperature as the injectate-diluted blood passes a temperature sensor 10 cm downstream at the end of the catheter:
Each injection yields in a time-temperature curve whose area represents the cardiac output:
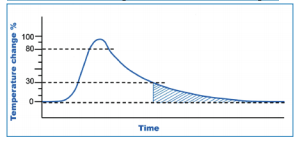
Note that the vertical axis represents temperature change, not actual temperature. The equation for determining cardiac output requires a number of fixed values: the density of blood, the density of injectate, the specific heat of blood, the specific heat of injectate, the volume of injectate, and a correction factor specific to the catheter. The equation is pre-programmed into the monitor in use:
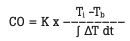
Where K represents the fixed-factor part of the equation, and ∫ ΔT dt is the area under the curve.
Corrections are also made to compensate for the extended ‘tail’ created by the gradual dilution by the injectate (cross-hatched in the graphic above). Manufacturers provide the “computational constant” for each model of pulmonary artery catheter. Depending on the injectate volume and temperature, it may range from 0.132 to 0.608. Ultimately the only variables necessary to input to the monitor are the temperature of the blood (Tb) and that of the injectate (Ti). “Shooting” cardiac outputs is both art and science: the injection must be done quickly, and in one smooth action, in order to create nearly ideal time-temperature curves.
Originally, iced injectate was used in order to assure a large difference between Ti and Tb, to provide better accuracy. With improvements in products and technique, “room temperature” injectate (~ 20 °C) is now more commonly used, unless the ambient room temperature is unusually high.
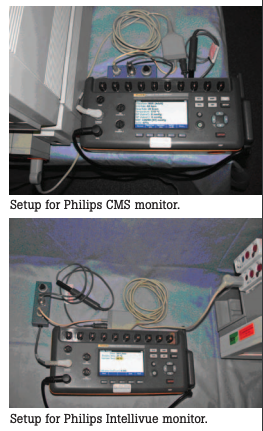
Simulation procedure for Philips monitors
The thermodilution method is used with any of these Philips modules:
- M1012A, standard or option #C10
- M3012A Hemodynamic Measurement Server Extension, option # C05
- M3014A Capnography Measurement Server Extension, option # C05
Connections
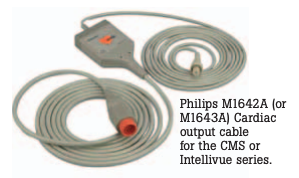
- Connect a Philips M1642A (or M1643A) cable to the CO module or server
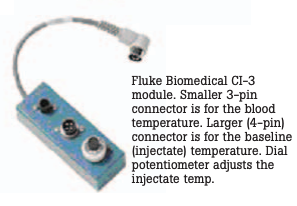
- Connect the 4-pin female blood temperature connector from the Philips cable to the 3-pin male on the Fluke Biomedical CI-3 module (Fluke Biomedical # 2392199)
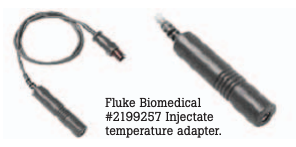
- Connect a 4-pin female injectate temperature adapter (Fluke Biomedical # 2199257) between the Philips cable to the 4-pin male on the CI-3
- Connect the CI-3 to the “Cardiac Output” port of the Prosim 8
Procedure
- On the Philips monitor, enter the C.O. setup window
- On some Philips models, select “Method” and choose “Right Heart”
- Enter a “Computational Constant” of 0.595. • If necessary, select a “Catheter Size” of 7 F
- If necessary, select an “Injectate Volume” of 10 cc
- On the CI-3 module, adjust the pot for a “Blood Temp” of 24 °C on the Philips screen. (This adjustment may be very critical.
- On the Prosim 8, press “Special Functions” • Navigate to “Cardiac Output”
- Navigate to the “Wave” parameter, and select 5.0 L/min
- Navigate to the “Baseline Temp” parameter, and select 37 °C
- Navigate to the “Injectate Temp” parameter, and select 24 °C
- With the “Ready for new measurement” message on the Philips monitor, press the “Start” button on the module (or use the pop-up key “Start CO” on-screen). There will be a tone and the message “Inject now!”
- Immediately press the “Start” softkey on the Prosim 8.
 A timer on the Prosim 8 will begin counting-down and a simulated CO waveform will appear on the Philips screen. Within 30 seconds, the Philips will determine and display a CO value, which should be 5.0 L/min ± 5 %.
After the message “Wait before starting new measurement” changes to “Ready for new measurement”, run at least 2 more measurements. To check a wide range of values, we suggest you also run a CO determination for “Wave” settings of 2.5 L/ min and for 10 L/min on the Prosim 8.
If you run CO determinations for iced (0 °C) injectate, don’t forget to change the Computational Constant on the Philips settings to 0.542. (The Prosim 8 will change to this value automatically when you select a 0 °C injectate temp.)
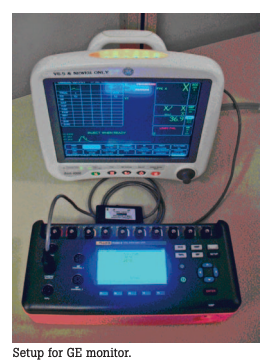
Simulation procedure for GE monitors
The thermodilution method is used with any of these GE monitors:
- Dash- series (3000, 4000, & 5000)
- Carescape Patient Data Module
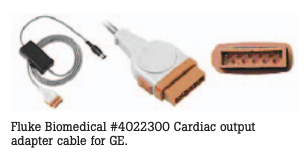
Connections
- Connect Fluke CO adapter cable (Fluke Biomedical # 4022300) from the monitor to the
- Cardiac Output port of the Prosim 8
Procedure
- On the GE monitor, navigate to the CO setup page
- In the “Catheter” box, select Baxter
- In the “Inject Temperature” box, select In-Line
- In the “Size” box, select 7 • In the “Inject Volume” box, select 10
- In the “Computational Constant” box, the CC should default to 0.595
- On the Prosim 8, press “Special Functions”
- Navigate to “Cardiac Output”
- Navigate to the “Wave” parameter, and select 5.0 L/min
- Navigate to the “Baseline Temp” parameter, and select 37 °C
- Navigate to the “Injectate Temp” parameter, and select 24 °C
- Set the rocker switch on the adapter cable to 24 °C
- With “Inject when ready” displayed on the GE monitor, press the “Start” softkey on the Prosim 8
A timer will begin counting down on the Prosim 8 and a simulated CO waveform will appear on the GE monitor screen, and “Computing CO” will display. Within 30 seconds, the monitor will determine and display a CO value, which should be 5.0 L/min ± 5 %. “CO complete” will display.
After the message “Inject when ready” returns, run at least 2 more measurements. To check a wide range of values, we suggest you also run a CO determination for “Wave” settings of 2.5 L/min and for 10 L/min on the Prosim 8.
References
Bowdle, et al: “Cardiac Output” in Biophysical Measurement Series Spacelabs Medical, 1993 ISBN 0-9627499-2-1
Chan, A: Biomedical Device Technology: Principles and Design C. Thomas. 2008 ISBN 978-0-398-07700-6
