QA-ES Application Note: Electrosurgical Analyzer Primer
Purpose
The purpose is to outline the characteristics of electrosurgical analyzers, describe the challenges of measuring RF power and review the inspection procedures recommended by international safety organizations. As part of this, a detailed analysis of the variables associated with this testing is conducted.
Scope
This document applies to testing standard electrosurgical units (ESU) and hyfrecators that use high-frequency electric current in the range of 300kHz through 1MHz to conduct surgical functions. This does not apply to electrocautery units that use heated electrodes in place of a scalpel. ESU modes of operation are restricted to monopolar and bipolar outputs from ground referenced and isolated ESUs.
Overview
Electrosurgical Generators
ESUs have evolved since first discovered in the early 1900s. Current day products utilize modern solid-state electronics to generate several different waveforms for a multitude of applications. Most are microprocessor driven, but a few still use analog technologies. The latter are used in less demanding settings such as clinics and doctor’s offices. The mode of operation, frequency range and power distribution curves are characteristics that contribute to the accuracy of an ESU analyzer.
ESUs are used to cut or coagulate tissue, or a combination of the two. The surgical outcome depends on the waveform generated by the ESU. A pure cut waveform is continuous, undamped and sinusoidal in shape. The fluid in the cell heats to the vaporization state, resulting in the cell exploding.
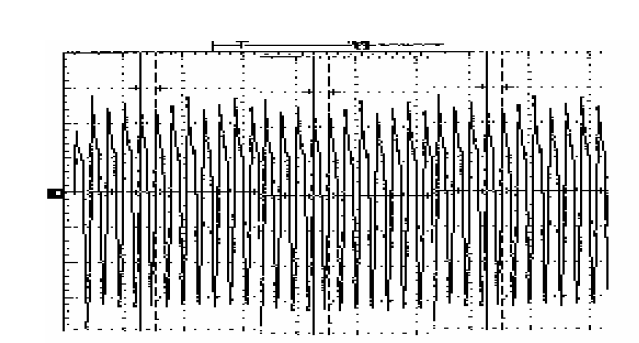
Figure 1: Graph of a pure cut waveform from an ESU
Coagulation, known as the coag mode, occurs when the cell fluid is allowed to cool between heating. The waveform consists of a dampened cut wave with an on time then an off time. The cell fluid heats during the on time then slightly cools during the off time. There are some cases where the surgeon wants to coagulate while cutting, thereby reducing the amount of blood loss. Some ESUs offer a “blend” mode that is a combination of the cut and coag output.
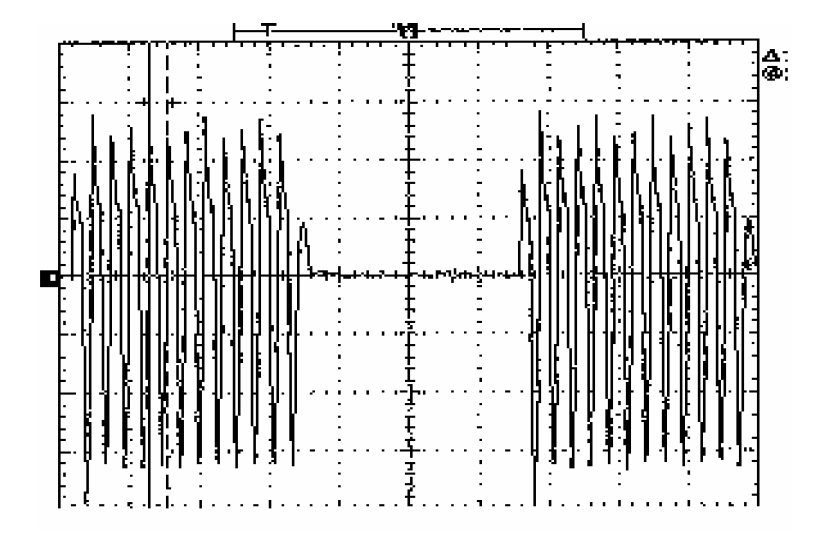
Figure 2: Graph of a Coag waveform from an ESU.
The frequency of a waveform is defined as the number of times it oscillates per second; it is designated as a Hertz. ESUs typically operate between 300kHz and 3 MHz, the medium frequency RF range. Research has demonstrated that the optimal surgical performance is achieved at 300 - 500 kHz. However, some ESU modes are more suited for a higher frequency, such as the bipolar mode.
The last characteristic of an ESU is the power distribution curve. It describes the output power as a function of the load. The power distribution curve typically starts below the set output value at a low resistance and increases with resistance until it peaks at the maximum power. The resistance at this maximum power point is the load setting recommended by the manufacturer for output testing in the specified mode. After the maximum is observed, the output power will decrease as the load is increased. The load resistance for each ESU varies, but typically is 300 ohms for monopolar and 100 ohms for bipolar. Hyfrecators typically specify a 500-ohm load.
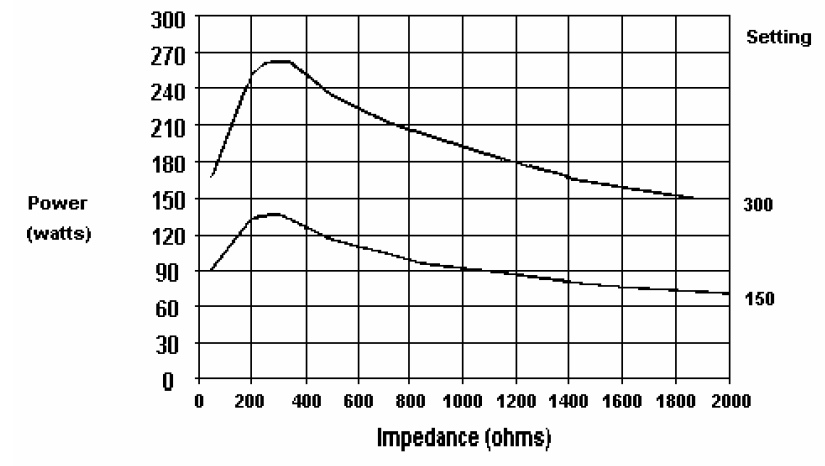
Figure 3: Power Distribution Curve for a typical ESU in pure cut mode
In Figure 3 above, the power curve is maximized at approximately 300 ohms and decreases at different slopes to either side of the maximum. For this ESU, the load selection is not extremely crucial, especially at the 150-watt setting, since the slope of the curve is small in the 300-ohms range. It should be noted that the slope of the curve approaches zero as the load increases.
Electrosurgical Analyzers
Electrosurgical analyzers are used to determine operator and patient safety for ESUs. The technician performing the tests measures the output power, HF/RF leakage, REM/CQM verification and waveform analysis. The values measured will be compared to the manufacturer’s claims on accuracy and previously measured values. The frequency of testing depends on the risk level associated with the ESU. ESUs are assigned a high risk level, therefore they are typically tested every 6 months.
An ESU analyzer can be as simple as a RF meter and a load resistor, or as complex as a RF meter with a varying load. A varying load would have a separate variable load for REM testing and a microprocessor for power calculations, displaying data and communication with peripherals. To design an ESU analyzer that offers the user the ability to test multiple varieties of ESUs found in a hospital requires that multiple test loads be available in the analyzer.
Another consideration includes the range of input and displayed power. Input power can range from a low of 1 watt to a high of 400 watts on some instruments. According to the ANSI/AAMI HF18-2001, output power can be determined by measuring the rms current in a non-reactive load or the rms voltage across the load resistance. Most ESU analyzers utilize the current measurement technique. The model RF303RS utilizes a voltage measurement technique.
The power equation is:
P = I2 * R
P = v2 / R
P = I * V
There are many variables that affect the accuracy and performance of an ESU analyzer. These variables contribute to the design challenges associated with the design of an analyzer. The accuracy variable is directly related to the impedance presented to the ESU. Not only does the ESU output vary based on the load presented by the analyzer but also the analyzer itself assumes the load is some value for all frequencies applied. Ideally, the load resistance should not vary with frequency if non-inductive resistors are used. However, when assembling several loads together in a convenient package, capacitance and inductance are introduced. For low load values, the inductance appears and makes the load more reactive as the frequency increases. For high load values, capacitance makes the load more reactive as the frequency increases. For load values between 200 and 400 ohms the load most resembles the ideal. In this case there is still a capacitance and inductance physically in the system, but the phasers are equal in magnitude and opposite in angle. Figure 4 illustrates the actual impedance of a 50-ohm wire wound resistor from 50 kHz to 10 MHz. Notice the impedance rises sharply as the frequency increases above 2 MHz.
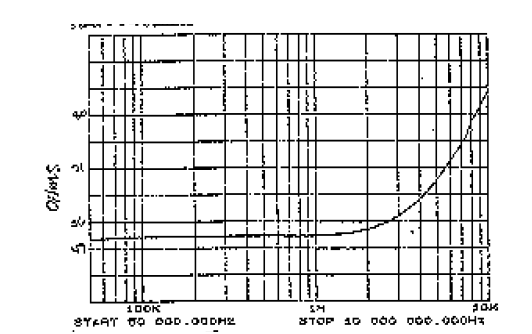
Figure 4: Frequency response of a 50 ohm 225 watt wire wound resistor
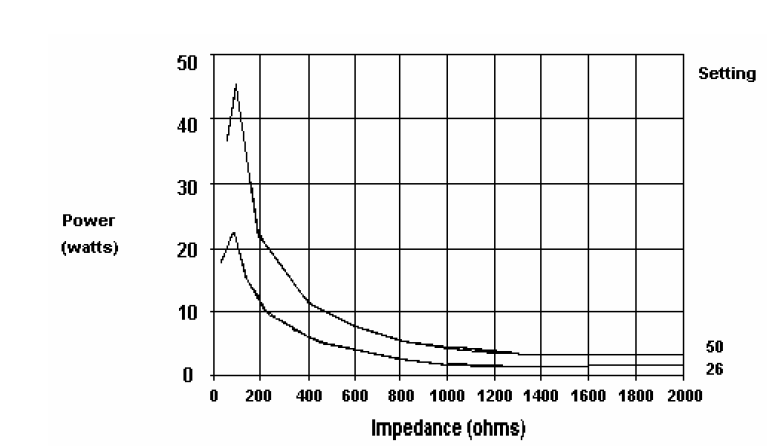
Figure 5: Power Distribution Curve for an ESU in Bipolar mode
Slight changes in the impedance presented to the ESU under test will produce an error that is different for each ESU make and model. For this ESU, the output changes dramatically between 50 and 200 ohms. It is very important that the selected load be near 50 ohms for an accurate measurement in this case.
How does a change in the reactance as a result of an ESU operating in the higher frequency affect the accuracy? The load is assumed to be resistive and at a nominal value. For example, assume an ESU has a pure cut-type waveform at 1 MHz, Vsource = 350 volts, Rs = 300 ohms, Z = 60 ohms at 1MHz, but 50 ohms at DC.
V = Vs * Z/(Z + Rs) P (volt) = V2/ 50
V = 58.33 volts P (volt) = 68 watts
I = Vs / (Z+Rs) P (curr) = I2 *50
I = 0.9722 A P (curr) = 47.3 watts
Notice the difference in power measurements calculated as a result of assuming a load that is different than the actual. Because of this, a comparison of two different ESU analyzers will not provide valuable information as to the operation of the ESU itself. If the analyzer consistently provides answers within a certain envelope, the ESU is operating consistently.
Some older ESUs output may “hesitate” under full power, meaning the peak-topeak amplitude of the output signal varies from one cycle to the next. This phenomenon contributes to the challenges of designing a digital electrosurgical analyzer. When sampling a signal with continuously-variable amplitude, the power calculated for each cycle will vary. Therefore, the average output power may not remain steady at all times. This may appear to be the analyzer, but is really the characteristic of the ESU. To display a consistent reading from an output signal with a combination of cut and coag becomes much more complex in a digital analyzer. The processor must determine what the rms value of the input signal is and understand there is some time when the signal is not providing any power. Generally, the challenge lies in capturing the signal and displaying a reading with any degree of accuracy.
Recommendations and Practices
There are several standards and recommended practices for Biomedical Engineers to follow as guidelines when testing electrosurgical units. Some are more comprehensive than others and can be difficult to implement in the field. For example, the IEC 601-2-2 and AAMI standards state the ESU must be placed on an insulating surface (preferably wood) that is 1 meter above the floor. This exact specification is not very practical for field-testing. From recommendations made in the IEC 60601-2-2, SECTION THREE – PROTECTION AGAISNST ELECTRICAL SHOCK HAZARDS and SECTION EITHT – ACCURACY OF OPERATING DATA AND PROTECTION AGAINST HAZARDOUS OUTPUT the following procedure can be pieced together:
- Test the Protective Earth Continuity, where applicable.
- Measure the leakage currents of applied parts.
- Measure the DC resistance between the active and dispersive electrodes or the two bipolar terminals.
- Functional test any monitoring circuit.
- Rated output power should be within ± 20% of the set value.
The Emergency Care Research Institute (ECRI) recommends approximately the same procedure with the exception of requesting a review of the service manual and manufacturer’s recommendations.
Before a calibration is performed on any ESU, it is highly recommended the technician not only be trained by the manufacturer but also know the instrument is out of specification. One error to avoid is assuming the displayed setting on the ESU is the actual output power setting. According to the IEC and AAMI standards the output control shall have a scale or associated indicator showing relative units or high frequency output. It shall not be marked unless the indicated power is delivered with an accuracy of ±20% over the load resistance range. The bottom line is make sure you review the service manual completely before opening the ESU.
One thing to remember about ESU analyzers and calibration is the load reactance will affect the measured value in some way. The inductance on the low load value will contribute to an opposing error on either side of the ideal reading depending on what measurement technique is used. The current measurement technique will measure with a negative error and the voltage measurement will exhibit a positive error. The most optimal instrument to use while calibrating the ESU would be one that measures both voltage and current. The technician can measure the phase angle, determine the impedance and adjust the output accordingly.
Regardless of the procedure selected to perform the inspection, the user should not calibrate ESUs using either the Voltage or Current measurement technique. We recommend the manufacturer calibrate the instrument once it is verified to be out of specification. The rationale is the load presented to the ESU is not ideal even if the load resistors are non-inductive.
Conclusions
Although ESU analyzers are designed to simplify the process, interpreting the results can be the more complicated part of functional testing an ESU. A technician should keep in mind the accuracy of an ESU analyzer is dependent on several factors. The load presented to the ESU will have a large impact on the accuracy of the measured power for the bipolar mode than in the monopolar mode because the power output changes dramatically near the maximum output. With any ESU analyzer, the load impedance is frequency-dependent; all loads have some capacitance and inductance. Therefore, bipolar test results are inherently not as accurate as monopolar.
The total accuracy of the test system is the summation of both the ESU and the analyzer accuracy. Therefore, for any given reading, a confidence level of 25% is not unreasonable if the ESU is specified as ±20% and ±5% for the RF3030RS analyzer. A more important measure of stability in an ESU is reproducibility for different loads.
To effectively calibrate the ESU, the voltage and current should be measured to determine the power factor. We recommend the manufacturer calibrate the instrument once it is found to be out of specification.
If an ESU analyzer is giving readings outside the specified range for a particular manufacturer, adjust the load setting and compare the results to the power distribution curve found in the service manual. This procedure isolates the frequency-dependent-load impedance issue described earlier.
If the ESU needs to be activated for more than 5 seconds before a reading is displayed on the analyzer, the analyzer manufacturer should be contacted. Activating the ESU for long periods of time may cause damage to the ESU.
From a safety standpoint, the REM/CQM system should be evaluated at the same time the output power and leakage is checked. This can consist of a go-no-go test using the RF303RS main load.