Prosim 8 App Note: Reconciling differences in noninvasive blood pressure simulations
By Dennis McMahon, Dennis McMahon Consulting
Since the day that Riva-Rocci invented the first practical sphygmomanometer, the accurate determination of blood pressure noninvasively has been a challenge. The auscultatory (or “manual”) method, despite efforts to standardize the procedure, remains far more art than science, since it requires a clinician (with good hearing) to use a prescribed technique, and to do it consistently. With the introduction of the first automated sphygmomanometers in the 1960’s, electronics took much of the art (and the uncertainty) out of the process, and presumably provided clinical values that were both accurate (i.e. they gave true values) and precise (i.e. they repeatedly gave the same values within a very narrow range).
Precision and accuracy are the twin ideals of any scientific measurement. It is equally important for a device to provide true data as it is for it to provide that same data reliably, whether the measurement is made twice or 200 times. Given the choice, would we want a digital volt meter that reads an erroneous voltage, but consistently, or one that reads the true voltage, but in only half of its readings? Ideally, we want the actual value, and we want that same value every time we measure. This issue was recognized in the earliest methods of blood pressure measurement. As one author stated, “The numbers may not be ‘right,’ but at least we operate from—as the jargon puts it—‘a common data base’”. (Bruner, p86)
In contrast to the direct measurement of blood pressure which invades an artery with a fluid-filled cannula and pressure transducer, noninvasive blood pressure (NIBP) monitors are designed to determine arterial blood pressure indirectly, in a two-step process: they determine the systolic value by detecting a physical phenomena (the first “snap” of an occluded artery) that is correlated with the pressure in the occluding cuff. As the pressure in the cuff is decreased, the diastolic pressure is determined as that pressure in the cuff when the artery ceases to fluctuate (or oscillate, hence the term “oscillometric” for this method.
Oscillometry is fraught with many variables that can compromise both accuracy and precision, and they are in two groups:
Patient-related
- Pulse rate
- An irregular rhythm can cause error blood pressure values because an irregular heartbeat generate highly variable pressures between beats
- Pulse volume (how much the vascular volume changes with each pulse)
- Age (neonate, pediatric, adolescent, adult, geriatric)
- Weight (soft tissue affects the transmission of pulses to the cuff)
- Position (supine, sitting, standing)
- Conditions that affect the vascular system (vaso-active drugs, pregnancy, etc)
- Emotional state (“white coat hypertension”, trauma, etc)
Monitor-related
- Cuff size, relative to the patient’s limb diameter
- Tubing dynamics (inside diameter, elasticity, length (which adds to volume)
- Tubing patency (leaks, usually at the connections)
- Artifact (noise) in the pneumatics or in the test environment
- The algorithm used in the logic circuit:
- the deflation mode of the cuff - in steps or by “bleeding-down”
- if in steps, what increments? (6 mmHg? 8 mmHg?)
- determination of the systolic, mean, and diastolic points
- filtering the changing pressure components from the baseline pressure
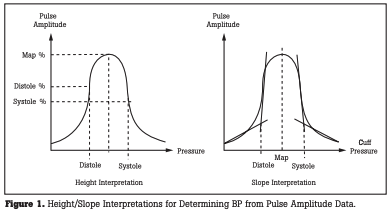
This last factor—the algorithm used to control the system and to process the data—is proprietary to each manufacturer of NIBP monitors. Over the past four decades, the various algorithms have been refined to deal with issues in the first models, such as extremes of hypotension, slow pulse rate, and inability to detect weak pulses. Today’s monitors are capable of reliably determining blood pressure in almost all clinical scenarios. But they differ in several key aspects, the most critical of which is the identification of the systolic and diastolic points. Some may use the height of the pressure waveform to mark these points; others may use the slope of the pressure signal:
The differences in algorithm create the differences in values given by the many NIBP monitors on the market, even if all other variables are fixed. So it is difficult to compare accuracy between blood pressure monitors from different manufacturers, but a good monitor should give consistent readings. It should repeatable.
In 1987, the Association for the Advancement of Medical Instrumentation (AAMI) published its Standard for Electronic or Automated Sphygmomanometers, SP-10 *. In its specification for overall system efficiency, it requires that the difference between the systolic and diastolic values and the “comparison system” should be ± 5 mmHg, with a standard deviation of no more than 8 mmHg (Section 3.4.2). One standard deviation represents about two-thirds of a population, so two-thirds of a sample population must be within 5 + 8 or 13 mmHg; but another 5 % might be as wide as 21 mmHg. The comparison methods they used are both the invasive technique and the auscultatory (“manual”) method, based on a large number of independent studies that included a wide range of patients. In effect, both the invasive method and the manual method are used as the “gold standard” against which NIBP monitor performance is referenced. Figure 1. Height/Slope Interpretations for Determining BP from Pulse Amplitude Data. Map % Distole % Distole Height Interpretation Slope Interpretation Systole % Systole Cuff Pressure Pressure Pulse Amplitude Pulse Amplitude Distole Map Systole C
When we are asked to verify the performance of an NIBP monitor with a simulator like the Fluke Biomedical ProSim 4 or ProSim 8 Vital Sign Simulators, all the design factors unique to the unit under test (UUT) will come into play, making it unrealistic to expect values that are identical, or even very close, to our pre-set values on the simulator. (The makers of other patient simulators have issued documents that advise the user of how much variability they have found among different models of NIBP monitor.) What we should expect, however, is precision: we should expect that the values given by the UUT are repeatable for normal and abnormal pressure simulations, even if they vary from the pre-set values. It is worthy of note that the standard for non-invasive automated sphygmomanometers by the International Organization of Legal Metrology (OIML R 16-2) includes this under their definition of a Patient Simulator: Note: This device is not used for testing accuracy but is required in assessing stability of performance. (Section 2.15)
Therefore, the simulator can be used to verify the performance of the blood pressure monitor by documenting the repeatability of the readings obtained. To do that, the simulator itself should generate repeatable signals. The ProSim 4 and ProSim 8 are able to generate repeatable signals within 2 mmHg.
In a brief analysis, it was found that values displayed for systolic and diastolic pressures could vary noticeably between the ProSim 8 and two earlier Fluke Biomedical simulator models (the BP Pump 2 and the Cufflink), but that the values were very repeatable. The one user-variable factor that can explain some of the differences in displayed values was pulse volume. On the ProSim 8, the default value for pulse volume is 1 ml. On other models, the default pulse volume varied with the pre-set from 0.55 ml to 0.75 ml.
Recommendations for performance testing an NIBP monitor
- Be consistent with your setup for all tests
- Use the same tubing set for connections between UUT, cuff, and simulator
- Tubing should be flexible but not soft (as latex or Silastic©)
- Tubing should be only long enough to serve the need, but not excessively long. (Excessive length adds volume to the test system)
- Check the cuff and connectors for leaks
- The test setup must be absolutely leak-free
- Small leaks may not be audible, but will contribute to measurement error
- Use a medium adult size BP cuff, or a rigid chamber of 100 or 500 mL
- Using an undersized or oversized cuff can result in consistently offset values. This is one of the most common errors with NIBP monitor testing
- If using a cuff, wrap it around a fairly rigid mandrel or cylinder, that has a cross-section that simulates an adult upper arm (8 to 10 cm [3 to 4 in] in diameter)
- During each NIBP cycle, avoid external interference to the setup or cuff
- Do not bump, shake, or otherwise send extrinsic signals to the test setup
- Extrinsic noise can interfere with the signal detection of the UUT
- Take three readings for each of three preset BP values (hypertensive, normal, and hypotensive)
- If any of the three differs significantly from the other two, take additional readings to determine if the UUT is unacceptably imprecise. If the three are consistent but out the specification for accuracy (as stated in the maker’s documentation), it should be taken out of service and repaired
- First readings may be significantly different from the following readings. This occurs when simulated values are changed dramatically from a low pre-set like 60/30 mmHg to a high pre-set such as 200/150 mmHg, because some monitors increase their cuff pressures very gradually to avoid injury to the patient. In that case, discard the first reading. Subsequent readings will be much more accurate and consistent. We recommend that you test from high pressure settings to low settings. Alternatively, cycling the power of the UUT will erase the previous readings from the volatile memory
- Perform tests for system leaks and for overpressure relief valve function
*This standard is now harmonized with other standards agencies as ANSI/AAMI?ISO 81060-2 (2009).